Sign up for the Family Tree Newsletter Plus, you’ll receive our 10 Essential Genealogy Research Forms PDF as a special thank you!
Get Your Free Genealogy Forms
"*" indicates required fields
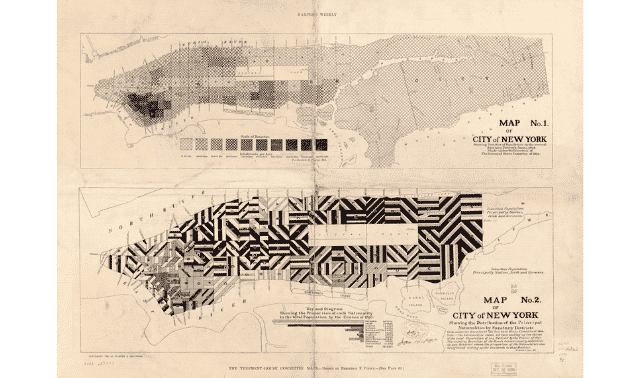
View the original, more-detailed map image here.
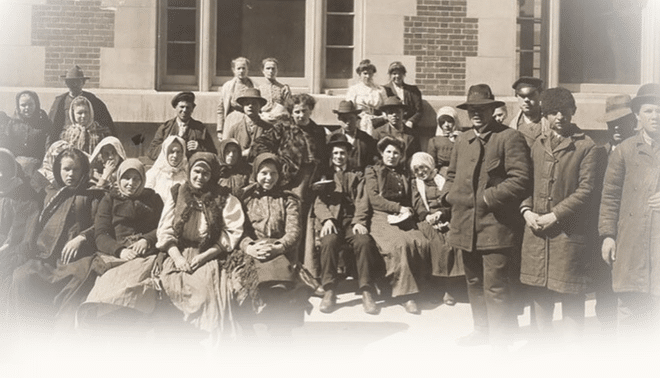
On April 17, 1907, Ellis Island processed 11,747 immigrants, the all-time daily high during the station’s 64-year history. But where did all those new arrivals go? Many moved inland to other parts of the country, often to communities of people from the same country or region. But others settled in the New York area to be with their fellow countrymen. Ethnographic maps can help you sort out this melting pot.
Ethnographic maps show where large populations of specific nationalities live within a city, state or other geographic region. This map, published in Harper’s Weekly in 1895, shows the major ethnic groups who lived in Manhattan during the (famously destroyed) 1890 US federal census.
Here, the lines and dots in each 1890 census enumeration district represent the largest ethnic group(s) in that part of the city. The width of a band indicates the relative proportion of that nationality compared to the whole population. The key at the bottom of the map indicates island-wide total: German (striped white line) and Irish (white line), followed by “Native” (i.e., people of any nationality born in the United States, not “Native Americans”/American Indians; indicated in black), Russians and Poles (white and black striped line) and Italians (line with polka dots).
Let’s look at an example. District 22F, directly south of Central Park, has three lines indicating the largest nationalities. Solid black indicates native-born Americans, solid white for Irish, and white striped for Germans. The width of the bands indicates that the native-born population is significantly larger than the Irish population, which in turn is much larger than the German population. Compare that to district 6A (a few districts north of the Battery), which equal-sized has Irish, German and Italian nationalities.
So how can you use this information? Ethnographic data communicates volumes about the community at both the city and district level. For example, Lower Manhattan was clearly a hotbed for immigrants, with numerous districts in that part of the island having majorities of German, Irish and Italian immigrants. Meanwhile, the community becomes more homogenous as you travel north on the island. There, native-born Americans and Irish make up the majorities in many Midtown districts.
Related Reads


ADVERTISEMENT