Sign up for the Family Tree Newsletter Plus, you’ll receive our 10 Essential Genealogy Research Forms PDF as a special thank you!
Get Your Free Genealogy Forms
"*" indicates required fields
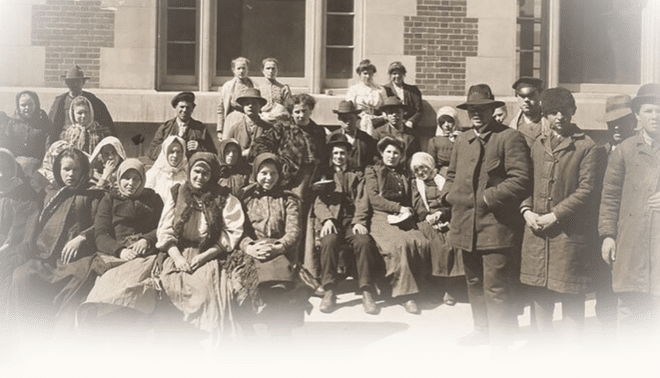
Millions of immigrants poured into the United States during the 19th century, forever changing the national landscape. And as genealogists, we study this great American melting pot and those who contributed to it. Immigrants settled where they could find work and affordable housing, often traveling in groups and settling in clumps. This foreign-born population map from 1880 tells part of their story.
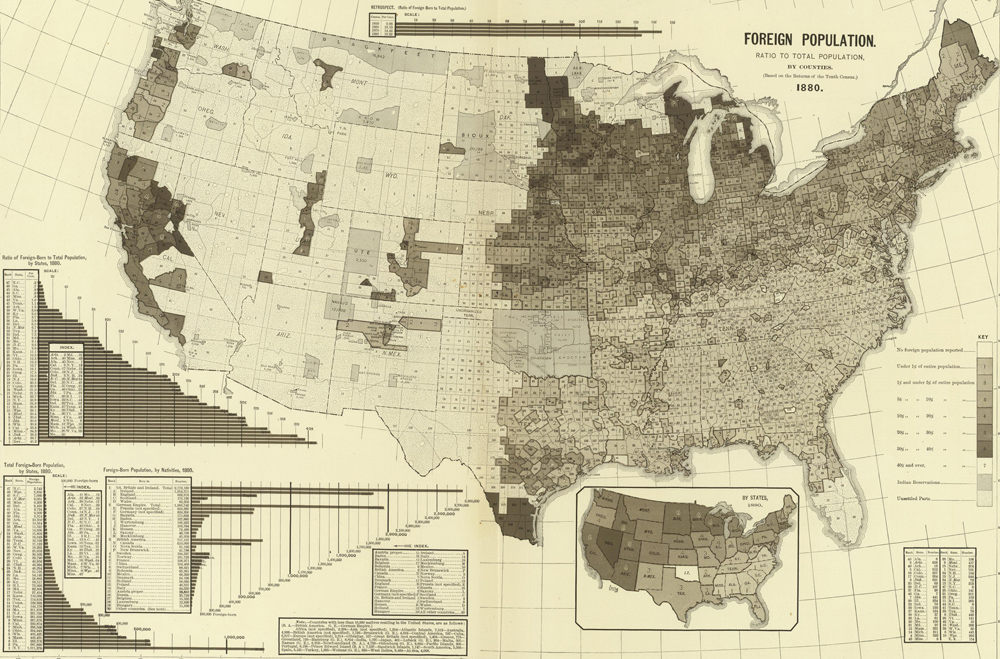
Each shade represents a different range of foreign-born inhabitants in that region or county as of the 1880 federal census. Darker shading indicates higher proportions of foreign-born residents in a community, ranging from 0 to 40-plus percent. Dotted areas indicate places that remain unsettled (such as Wyoming, west Texas and southern Florida).
As you might expect, Northeastern and Western states have some of the highest proportions of foreign-born residents. California, in particular, has a large foreign-born population, as do states in the Great Lakes region (especially Michigan and Minnesota). The South, however, generally has low rates of foreign-born residents. We can also see spikes around urban centers across the country, notably Salt Lake City, Utah, and Denver, Colorado. Immigrants flocked to these communities to find work.
Bar charts in the lower corner give additional details. The first indicates the percentage of foreign-born inhabitants in each state, and the second provides the actual number. North Carolina (at 3,742 foreign-born residents, less than 1 percent of its total population) has both the lowest percentage of foreign-born residents and the lowest total number. New York, unsurprisingly, has the most foreign-born inhabitants with 1,211,379, but Nevada (with more than 40 percent of its population foreign-born) has the highest percentage.
The third bar chart, “Foreign-Born Population, by Nativities, 1880” breaks down national origins. By examining this, we can see how prominent each ethnicity was—plus how it shapes the country today.
Great Britain and Ireland (then technically known as the United Kingdom) leads the pack with more than 2.7 million ex-patriots, more than two-thirds of whom come from Ireland. English, Scottish and Irish remain among the most common European ancestries among Americans today.
The newly formed German Empire follows with 1.9 million. It’s interesting to note that many of these “German”-American residents responded with a region (Prussia, Baden, Bavaria, etc.) instead of “Germany.” Since a unified Germany only came about in 1871 (after many residents had immigrated), German-Americans still felt loyalty to their independent state, rather than the new German Empire. Roughly one in eight Americans report having German ancestry today, with especially prominent communities in the Midwest and Great Lakes regions.
“British America” takes third with 717,000 residents, almost all of whom hail from Canada. Many Canadians immigrated to the United States in search of economic opportunities in the mid-1800s, likely contributing to the heavily foreign-born population in Michigan, Wisconsin and Minnesota.
This map reminds us that the United States has always been a nation of immigrants. You can use it (and others like it) to determine how your ancestors fit in with the surrounding community. Were your ancestors some of the only immigrants in their county or state, or were they part of a large wave of migration?
ADVERTISEMENT